Multiple Choice
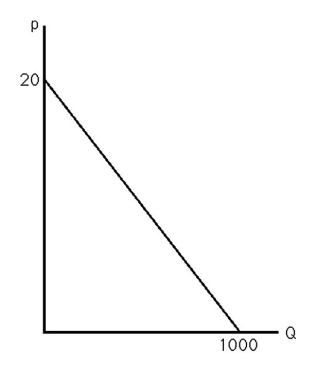
-The above figure shows the demand curve for crude oil.The demand curve has unitary price elasticity when price equals
A) $0.
B) $1.
C) $10.
D) $20.
Correct Answer:

Verified
Correct Answer:
Verified
Related Questions
Q50: The elasticity of demand for employees is
Q51: Suppose that a specific tax of $3
Q52: Only in the case of perfectly inelastic
Q53: The market demand for wheat is Q
Q54: The short-run price elasticity of demand for
Q56: The percentage change in the quantity supplied
Q57: A vertical supply curve exhibits<br>A) a constant
Q58: Suppose the inverse demand curve for a
Q59: Which of the following goods probably has
Q60: If the demand for orange juice is