Multiple Choice
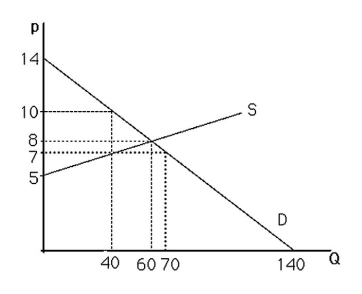
-The above figure shows a graph of the market for pizzas in a large town.No pizzas will be demanded unless price is less than
A) $0.
B) $5.
C) $12.
D) $14.
Correct Answer:

Verified
Correct Answer:
Verified
Related Questions
Q53: Government actions can cause a<br>A) shift in
Q54: If the price of automobiles were to
Q55: Suppose that firm A obtained a patent
Q56: If on Tuesday the perceived price of
Q57: If the demand curve is vertical a
Q59: Assuming plasma TVs are a normal good,an
Q60: Import quotas on steel tend to result
Q61: To determine the total demand for all
Q62: The market supply curve is found by<br>A)
Q63: According to the Law of Demand,the demand