True/False
One hundred people were sampled from each of three populations and asked a question.The responses are shown in the table:
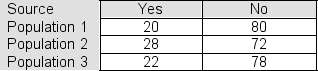 If the three populations represented here contain the same proportion of yes responses, we would have expected to see 23.33 yes responses in each sample.
Correct Answer:

Verified
Correct Answer:
Verified
Q132: Use a statistical calculator to find the
Q133: The degrees of freedom for in a
Q134: An NBC/Wall Street Journal poll asked
Q135: One hundred CEOs were sampled from each
Q136: The partially completed contingency table below shows
Q138: A 2012 Gallup poll of collected
Q139: The partially completed contingency table below shows
Q140: Pollsters have tracked presidential approval ratings
Q141: In a consumer survey designed to assess
Q142: Below is a contingency table showing the