Pollsters Have Tracked Presidential Approval Ratings Over Many Decades 2stat Is Greater Than the Critical Value
Multiple Choice
Pollsters have tracked presidential approval ratings over many decades.From 1945 to 2009, the percentage of adults who approved of the job being done by the president averaged 54%, with 36% disapproving and 10% not sure. In June 2009, an NBC/Wall Street Journal poll asked 2000 adults, "In general, do you approve or disapprove of the job Barack Obama is doing as president?" The responses were as follows: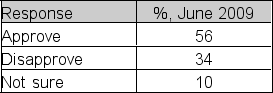 A researcher conducts a goodness of fit test to determine whether President Obama's June 2009 approval ratings differ significantly from the historical average.The hypotheses tested are as follows:
H0: The population proportion that approves is 0.54, that disapproves is 0.36, and that is unsure is 0.10.
Ha: The population proportions are not 0.54, 0.36, and 0.10 respectively.
At a 5% significance level, what is the conclusion of the hypothesis test?
A) Since 2stat is greater than the critical value 2c, reject the null hypothesis.The evidence supports the claim that President Obama's ratings differ from the historical averages.
B) Since 2stat is not greater than the critical value 2c, do not reject the null hypothesis.The evidence does not support the claim that President Obama's ratings differ from the historical averages.
C) Since 2stat is greater than the critical value 2c, reject the null hypothesis.The evidence does not the claim that President Obama's ratings differ from the historical averages.
D) Since 2stat is not greater than the critical value 2c, do not reject the null hypothesis.The evidence supports the claim that President Obama's ratings differ from the historical averages.
Correct Answer:

Verified
Correct Answer:
Verified
Q116: In a consumer survey designed to assess
Q117: Ballantine Venture Capital recently conducted a survey
Q118: The number of degrees of freedom for
Q119: Economic Review reported that for 50% of
Q120: Samples of equal size have been selected
Q122: In a chi-square distribution with df =
Q123: In a chi-square distribution, <span
Q124: The HR manager at Hernandez Inc.reports that
Q125: One thousand people were sampled from each
Q126: It is reported that 70% of car