Multiple Choice
Flagg and Rossi own a fleet of four limos.The current odometer readings for the four limos are shown in the table below:  Suppose you were to take all possible simple random samples of size 2 that could be selected from this limo population and calculated the sample mean odometer reading for each sample.Which one of the following graphs shows the sampling distribution of the sample mean?
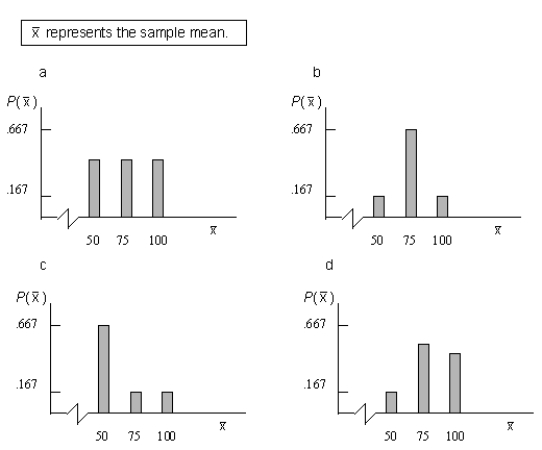
A) Graph a
B) Graph b
C) Graph c
D) Graph d
E) none of the above
Correct Answer:

Verified
Correct Answer:
Verified
Q70: The law of large numbers establishes that
Q71: Which of the following is not a
Q72: The table below shows the names of
Q73: An example of systematic sampling is when
Q74: Chen Inc.wants to estimate the TOTAL processing
Q76: In a study of the paperwork required
Q77: Sampling with replacement is a sampling procedure
Q78: Crawford Retailing has 6 sales reps, designated
Q79: When constructing a confidence interval, an increase
Q80: You plan to build a 95% confidence