Multiple Choice
The number of job offers received by this year's five International Business graduates of Barlow College are shown below:  Suppose you were to take all possible simple random samples of size 2 that could be selected from this graduate population and calculated the sample mean number of offers for each sample.Which one of the following graphs shows the sampling distribution of the sample mean?
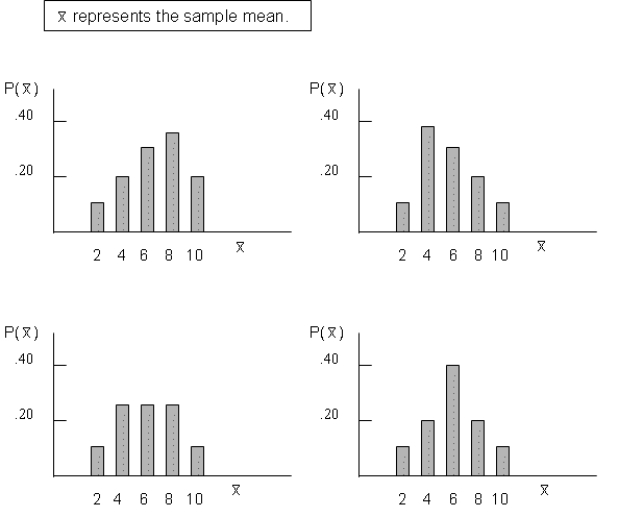
A) Graph a
B) Graph b
C) Graph c
D) Graph d
E) none of the above
Correct Answer:

Verified
Correct Answer:
Verified
Q50: Torres Electronics wants to estimate the average
Q51: Some of the reasons for sampling rather
Q52: Which of the following is NOT true
Q54: The statistical principle that guarantees a near-normal
Q56: In a sample survey of 68 high-tech
Q57: In a random sample of 341 U.S.companies,
Q58: Which of the following is NOT
Q59: A single number that is the best
Q60: Stratified sampling works best when differences between
Q105: As the sample size increases,the standard error