Multiple Choice
Which graph below shows the shape of the Poisson distribution for λ = 5? 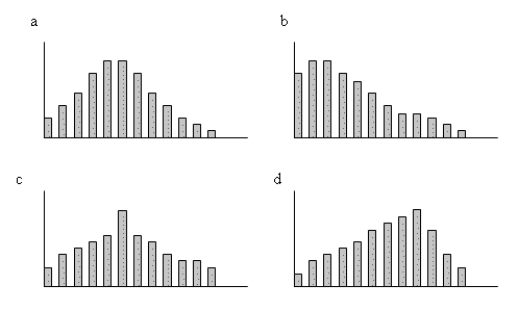
A) a
B) b
C) c
D) d
E) none of the above
Correct Answer:

Verified
Correct Answer:
Verified
Related Questions
Q73: The expected value or mean of a
Q74: In a study of NBA basketball games,
Q75: Salem University's MBA program has a 55%
Q76: The binomial probability for P(x < 2),
Q77: Salem University's MBA program has a 55%
Q79: Ten percent of graduating college seniors report
Q80: Below is a table showing the probability
Q81: The standard deviation of a discrete probability
Q82: The binomial probability for P(x = 5),
Q83: Below is a table showing the probability