Multiple Choice
Atlantic Power and Light tracked daily power surges over the last 500 days.Results are reported in the relative frequency table below.Compute the standard deviation for the daily power surge data. 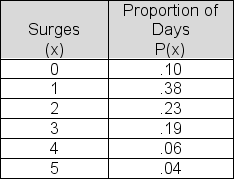
A) 1.48
B) 1.89
C) 1.72
D) 1.66
E) 1.24
Correct Answer:

Verified
Correct Answer:
Verified
Related Questions
Q1: The closing share price for G.E.stock over
Q2: If a data set has an even
Q3: Carnival Cruise Lines reported the number of
Q4: A frequency distribution is:<br>A)a tabular summary of
Q6: In computing descriptive statistics from grouped data,
Q7: A descriptive measure that is NOT measured
Q8: Below is a list of shipping costs
Q9: The table shows the life expectancy in
Q10: Below is a frequency table showing the
Q11: A data set contains only two values.The