Multiple Choice
The relative frequency table below shows the closing share price changes for the 100 most actively traded NASDAQ stocks yesterday.Use the grouped data table to approximate the standard deviation for the data represented. 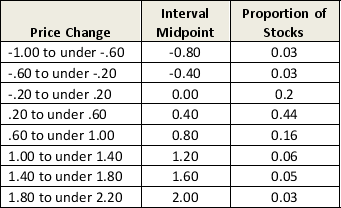
A) 1.22
B) .30
C) .83
D) .16
E) .55
Correct Answer:

Verified
Correct Answer:
Verified
Related Questions
Q38: In a bar chart, the height of
Q39: The mean absolute deviation (MAD) measures the
Q40: Below is a table showing the ages
Q41: When working with grouped data, an approximate
Q42: If the standard deviation of a data
Q44: The table shows the phone charge for
Q45: Which of the following graphical presentations for
Q46: Carnival Cruise Lines reported the number of
Q47: The range is the difference between the
Q48: The table below summarizes the prices of