Multiple Choice
What can be interpreted from the following graph? 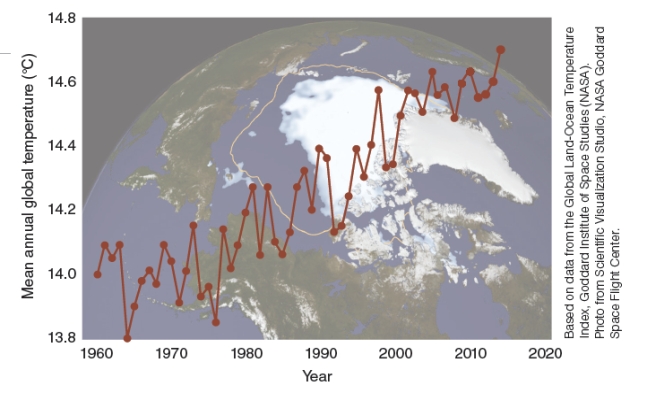 1. The graph shows that the Earth's surface temperatures do naturally fluctuate. 2. The graph shows that there has been a warming trend in the last several decades.
A) 1 only
B) 2 only
C) 1&2
D) None of these choices
Correct Answer:

Verified
Correct Answer:
Verified
Q37: The cooling effects of atmospheric aerosols are
Q38: Describe the difference between mitigation and adaptation
Q39: Which greenhouse gas that is released as
Q40: Which of the following is not a
Q41: What causes variation in precipitation? List and
Q43: Which of the following greenhouse gases has
Q44: Which of the following statements about precipitation
Q45: How much does the Intergovernmental Panel on
Q46: Which of the following greenhouse gases is
Q47: What type of cancer is expected to