Multiple Choice
The graph below shows atmospheric concentration of CO2 as recorded at the Mauna Loa Observatory. From the graph we can see that there are seasonal fluctuations in CO2 concentrations that correspond with: 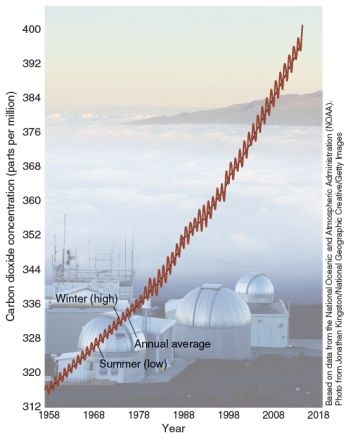
A) Plants taking up more carbon dioxide in the growing season.
B) Temperatures fluctuating between day and night.
C) Plants releasing more carbon dioxide in the growing season.
D) Cattle producing more methane in the summer when they are grazing.
Correct Answer:

Verified
Correct Answer:
Verified
Q47: What type of cancer is expected to
Q48: In science the terms climate and weather
Q49: Assuming the absence of air pollution control
Q50: Besides temperature records, evidence that points to
Q51: Scientists collect current data about the Earth's
Q53: Why is carbon dioxide considered a greenhouse
Q54: Which of the following is not an
Q55: Which of the following greenhouse gases is
Q56: How has stratospheric ozone loss disrupted food
Q57: Methane is produced from all of the