Multiple Choice
What can be inferred from the graph below? 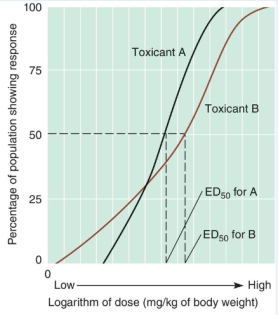
A) The biological response for both toxicants increases as the dose is increased.
B) For both toxicants, a harmful response occurs only above a certain threshold level, that is different for each toxicant.
C) Toxicant A has a lower effective dose-50 percent (ED50) than toxicant B.
D) All of the above can be inferred from the graph.
Correct Answer:

Verified
Correct Answer:
Verified
Q1: The study of the effects of chemical,
Q2: We measure toxicity by the dose at
Q4: What can be interpreted from the graph
Q5: Which of the following statements about children
Q6: Chemical A has a toxicity level of
Q7: Which of the following characteristics caused DDT
Q8: What is a pandemic?<br>A)an acute disease<br>B)a toxic
Q9: What is E. coli?<br>A)bacteria<br>B)virus<br>C)protozoa<br>D)parasitic worm
Q10: Who is an epidemiologist? Discuss the relationship
Q11: Currently, toxicologists use to assign risk to