Multiple Choice
According to the graph below: 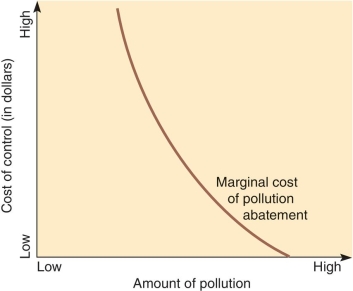
A) As more and more pollution is eliminated from the environment, the cost of removing each additional unit of pollution decreases.
B) As more and more pollution is eliminated from the environment, the cost of removing each additional unit of pollution increases.
C) Cost of pollution removal is constant regardless of how polluted an area is.
D) Cost of pollution is relative to the type of pollution
Correct Answer:

Verified
Correct Answer:
Verified
Q59: An Environmental Impact Statement must include:<br>A)an ethical
Q60: The engraving shown below is the work
Q61: All of the following would contribute to
Q62: What is NEPA and how did it
Q63: The study of how people use their
Q65: The legislation that requires the federal government
Q66: Conservation and preservation are considered the same
Q67: What is natural capital? Draw a schematic
Q68: Setting aside undisturbed areas, maintaining them in
Q69: In the field of economics, the additional