Multiple Choice
According to the graph below, the world population reached 7 billion around what year? 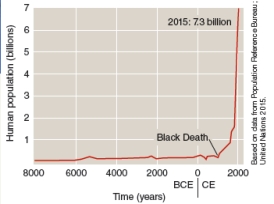
A) 1900 CE
B) 2015 BCE
C) 2015 CE
D) Around the time of the Black Death
Correct Answer:

Verified
Correct Answer:
Verified
Related Questions
Q7: In the United States ecological footprint of
Q8: A state agency has contacted you to
Q9: To improve their economic conditions, many LDCs
Q10: Which of the following represents consumption overpopulation?
Q11: The interdisciplinary study of humanity's relationship with
Q13: The photograph below is an image of
Q14: How do moderately developed countries MOST differ
Q15: Compare and contrast renewable and nonrenewable resources.
Q16: How does science obtain knowledge about the
Q17: Which of the following is most likely