Multiple Choice
What does this graph suggests about our current use of fossil fuels? 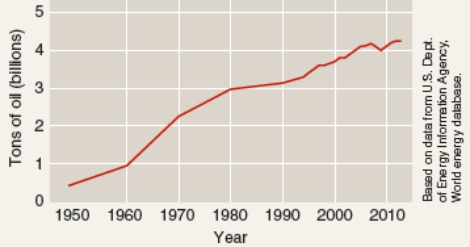
A) We are treating this resource sustainably as the number of barrels of oil consumed has increased over time.
B) We are depleting this non-renewable resource at a rate faster today than 20 years ago.
C) The price of oil will continue to decrease as there is more oil supply than there is demand.
D) We have found many new sources of oil as reflected in the increase in oil consumption.
Correct Answer:

Verified
Correct Answer:
Verified
Q47: Define environmental sustainability. Discuss three reasons why
Q48: What does an ecological footprint measure?<br>A)Natural resources
Q49: Which of the following is a nonrenewable
Q50: Which of the following stages comes LAST
Q51: Which of the following describes a highly
Q53: From the figure below we can interpret
Q54: In the scientific method, a hypothesis<br>A)is a
Q55: When you complained to a friend from
Q56: The scientific analysis and the study of
Q57: In order to estimate human impact on