Essay
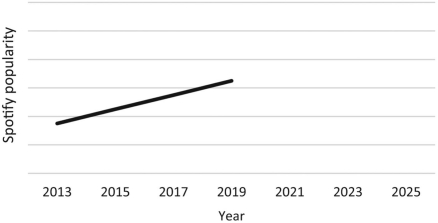
The following is a graph showing an increase in the popularity of the Spotify music streaming service between the years 2013 and 2019.Complete the graph by drawing two lines, one corresponding to what a dialectical person would predict will happen between 2019 and 2025 and one corresponding to what a nondialectical person would predict will happen between 2019 and 2025.
Correct Answer:

Verified
The nondialectical line should...View Answer
Unlock this answer now
Get Access to more Verified Answers free of charge
Correct Answer:
Verified
View Answer
Unlock this answer now
Get Access to more Verified Answers free of charge
Q12: Last week you went on a date
Q13: Several classmates are leaving the library when
Q14: Why is implicit communication more common and
Q15: Sybil was born and raised in the
Q16: Two health psychology researchers, Marie from North
Q18: Which of the following statements reflects a
Q19: Whereas analytic thinking is related to _,
Q20: Eric and Andy are sitting on a
Q21: Bagiai is a member of the Piraha
Q22: You work at your university's tutoring center,