Multiple Choice
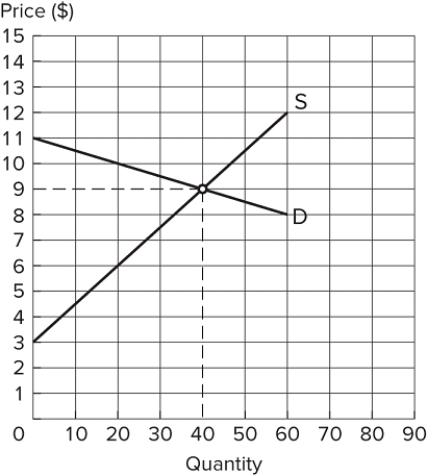 Assume the market depicted in the graph is in equilibrium. What is total surplus?
A) $160
B) $180
C) $320
D) $360
Correct Answer:

Verified
Correct Answer:
Verified
Q7: Consider a market that is currently in
Q7: <img src="https://d2lvgg3v3hfg70.cloudfront.net/TB8422/.jpg" alt=" According to the
Q11: <img src="https://d2lvgg3v3hfg70.cloudfront.net/TB8422/.jpg" alt=" Assume the market
Q13: <img src="https://d2lvgg3v3hfg70.cloudfront.net/TB8422/.jpg" alt=" Assume the market
Q14: <img src="https://d2lvgg3v3hfg70.cloudfront.net/TB8422/.jpg" alt=" Assume the market
Q25: Assume there are three hardware stores, each
Q48: In a well-functioning competitive market, total surplus:<br>A)
Q80: Total surplus can be increased by:<br>A) policies
Q87: A market has four individuals, each considering
Q90: When a market is missing:<br>A) deadweight loss