Multiple Choice
The graph shown displays a market with an externality. 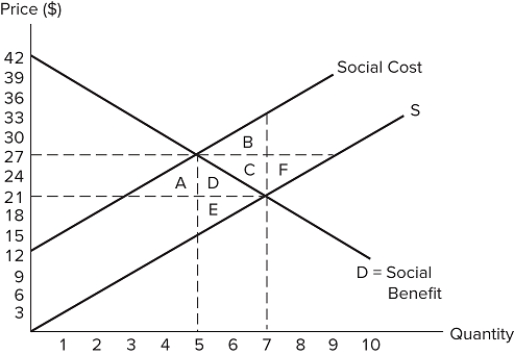 Which areas represent deadweight loss?
A) A + D
B) D + E
C) C + F
D) B + C
Correct Answer:

Verified
Correct Answer:
Verified
Related Questions
Q121: A market with a positive externality has
Q122: One way to make consumers take a
Q123: An example of a Pigovian tax would
Q124: Who gains surplus when consumers in a
Q125: The net increase to total surplus when
Q126: The graph shown displays a market with
Q127: Correcting a market with an externality through
Q128: The Coase theorem will hold only if:<br>A)transactions
Q130: When a positive externality is present in
Q131: When a quota is imposed on a