Multiple Choice
The graph shown displays the cost and revenue curves associated with a monopolistically competitive firm. 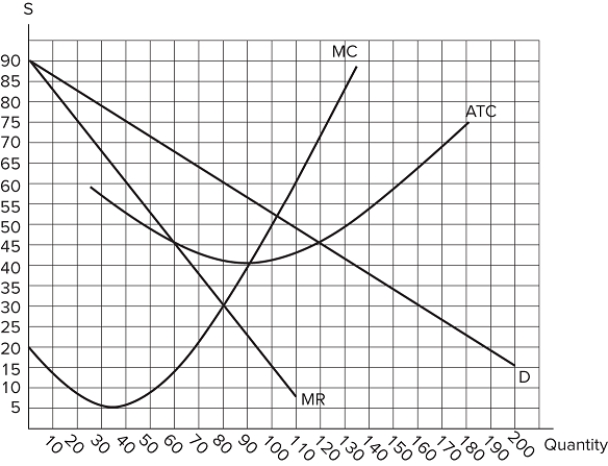 This firm will produce _______ units and charge a price of _______.
A) 60; $45
B) 80; $30
C) 80; $60
D) 90; $40
Correct Answer:

Verified
Correct Answer:
Verified
Related Questions
Q15: The game matrix shown displays the payoffs
Q16: If a monopolistically competitive firm's demand curve
Q17: For the monopolistically competitive firm, the steepness
Q18: Two firms in an oligopolistic market, Firm
Q19: The graph shown displays the cost and
Q21: What signal does a company give by
Q22: Two firms in an oligopolistic market, Firm
Q23: Collusion is:<br>A)buyers acting in unison against a
Q24: Suppose Coca-Cola controls 80 percent of the
Q25: If a government were to regulate a