Multiple Choice
The graph shown displays the cost and revenue curves associated with a monopolistically competitive firm in the short run. 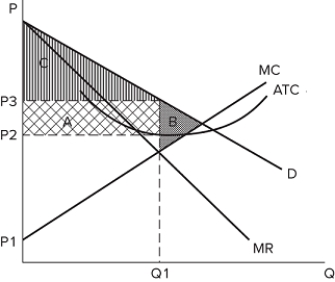 In the long run we can expect that:
A) firms will enter the market.
B) firms will exit the market.
C) price will increase.
D) profits will increase.
Correct Answer:

Verified
Correct Answer:
Verified
Related Questions
Q28: Which of the following would cause a
Q29: The goods or services that firms in
Q30: A group of firms who collude to
Q31: Standardized products can appear:<br>A)only in perfectly competitive
Q32: In the long run, firms in a
Q34: The graph shown displays the cost and
Q35: Which of the following is one of
Q36: Why is it difficult to regulate a
Q37: The prisoner's dilemma shown displays the payoffs
Q38: The prisoner's dilemma shown displays the payoffs