Multiple Choice
The graph shown represents the cost and revenue curves faced by a monopoly. 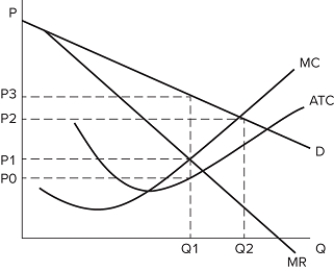 If Q2 units are being produced, the monopolist:
A) is not maximizing profits.
B) is producing where marginal costs are less than marginal revenue.
C) is earning negative profits.
D) should increase production.
Correct Answer:

Verified
Correct Answer:
Verified
Q1: Some argue that the best government response
Q2: If an inefficient public monopoly cannot provide
Q3: Perfect price discrimination:<br>A)requires each customer to pay
Q4: Producing any quantity of output less than
Q6: If a monopoly wishes to sell more
Q7: For a monopoly, marginal revenue for all
Q8: For a monopoly, for all units greater
Q9: In general, with a monopolist's outcome:<br>A)consumers lose
Q10: Public policy responses to monopolies:<br>A)sometimes aim to
Q11: Perfect price discrimination:<br>A)eliminates all consumer surplus.<br>B)maximizes producer