Multiple Choice
The graph shown represents the cost and revenue curves faced by a monopoly. 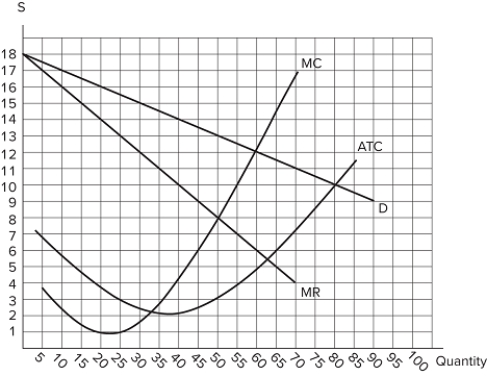 What is the deadweight loss in this market?
A) $0
B) $25
C) $70
D) $150
Correct Answer:

Verified
Correct Answer:
Verified
Related Questions
Q56: For a monopoly, when marginal revenue is
Q57: To avoid subsidies, the government should cap
Q58: A consequence of a publicly-owned natural monopoly
Q59: The presence of a privately-owned monopoly is
Q60: For a monopoly, a negative marginal revenue
Q62: DeBeers, a diamond seller, profits the most
Q63: When a government owns a natural monopoly
Q64: A perfect monopoly:<br>A)has no competition at all.<br>B)has
Q65: When a perfectly competitive firm increases output,
Q66: In the real world, price discrimination is