Multiple Choice
Use the following to answer questions:
Figure: The Market for Blue Jeans 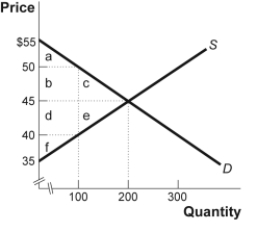
-(Figure: The Market for Blue Jeans) Look at the figure The Market for Blue Jeans. The government recently levied a $10 tax on the producers of blue jeans. What area or areas in the graph identify the loss of consumer surplus due to the tax?
A) c
B) b + c
C) b
D) a + b + c
Correct Answer:

Verified
Correct Answer:
Verified
Q15: Tax incidence analysis seeks to determine:<br>A)who sends
Q38: The demand for food is very inelastic
Q125: Suppose Governor Meridias initiates a payroll tax
Q130: A tax that takes a _ percentage
Q138: Use the following to answer questions:<br>Figure: Tax
Q139: Use the following to answer questions:<br>Figure: Tax
Q142: A tax is progressive if the tax
Q145: Use the following to answer questions:<br>Figure: The
Q147: Assume the same upward supply curve for
Q156: _ taxes are paid on the purchase