Multiple Choice
Use the following to answer questions:
Figure: The Demand Curve for Oil 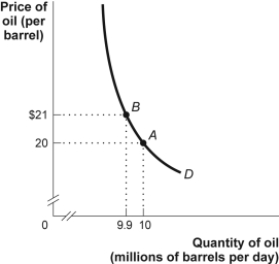
-(Figure: The Demand Curve for Oil) Look at the figure The Demand Curve for Oil. The price elasticity of demand between $20 and $21, by the midpoint method, is approximately:
A) 0.21.
B) 0.49.
C) 2.1.
D) 4.9.
Correct Answer:

Verified
Correct Answer:
Verified
Q87: The percent change in quantity demanded of
Q90: Use the following to answer questions:<br>Figure: The
Q91: In the short run, the price elasticity
Q93: The price elasticity of a good will
Q95: All else equal, when the demand for
Q97: If the price elasticity of supply is
Q98: If the income elasticity of demand for
Q99: Use the following to answer questions:<br>Figure: The
Q119: A demand curve that is perfectly inelastic
Q174: If the demand for golf is price-inelastic