Multiple Choice
Use the following to answer questions:
Figure: The Demand Curve for Oil 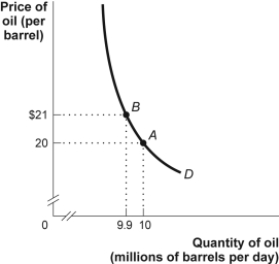
-(Figure: The Demand Curve for Oil) Look at the figure The Demand Curve for Oil. Demand is price _____ between $20 and $21, since total revenue _____ when the price _____.
A) elastic; increases; decreases
B) inelastic; stays the same; decreases
C) elastic; decreases; increases
D) inelastic; increases; increases
Correct Answer:

Verified
Correct Answer:
Verified
Q79: If an increase in the price of
Q83: Use the following to answer questions:<br>Figure: The
Q84: Use the following to answer questions: <img
Q86: Suppose the income of canned pinto bean
Q87: There are several close substitutes for Bayer
Q87: The percent change in quantity demanded of
Q90: Use the following to answer questions:<br>Figure: The
Q91: In the short run, the price elasticity
Q93: The price elasticity of a good will
Q119: A demand curve that is perfectly inelastic