Multiple Choice
Use the following to answer questions:
Figure: The Demand Curve 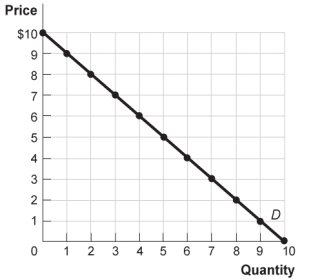
-(Figure: The Demand Curve) Look at the figure The Demand Curve. By the midpoint method, the price elasticity of demand between $1 and $2 is approximately:
A) 0.16.
B) 0.56.
C) 1.80.
D) 5.67.
Correct Answer:

Verified
Correct Answer:
Verified
Q14: If the price elasticity of supply is
Q15: If two goods are substitutes, their cross-price
Q16: Suppose the price of university sweatshirts increases
Q21: Suppose the price of Vanilla Coke increases
Q22: Suppose the cross-price elasticity between two goods
Q23: All of the following are characteristics of
Q24: The long-run price elasticity of supply of
Q145: When the price goes down,the quantity demanded
Q149: The price elasticity of demand for a
Q204: If demand is perfectly inelastic,changes in price