Multiple Choice
Use the following to answer questions:
Figure: Change in the Total Surplus 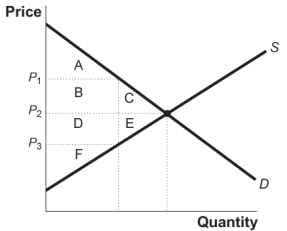
-(Figure: Change in Total Surplus) Look at the figure Change in Total Surplus. Which of the following areas represent the change in total surplus when the price falls from P2 to P3?
A) A, B, and C
B) B and C
C) B, C, D, and E
D) C and E
Correct Answer:

Verified
Correct Answer:
Verified
Q2: The total surplus generated in the market
Q8: Which of the following is a key
Q10: If there is an increase in supply,assuming
Q11: The total consumer surplus for good X
Q25: Maximum total surplus in the market for
Q31: Mark and Rasheed are at the bookstore
Q46: Assuming that the supply curve of cupcakes
Q142: When there is a positive amount of
Q209: If the demand curve for ice cream
Q229: Use the following to answer question: <img