Multiple Choice
Use the following to answer questions:
Figure: The Socially Optimal Quantity of Pollution 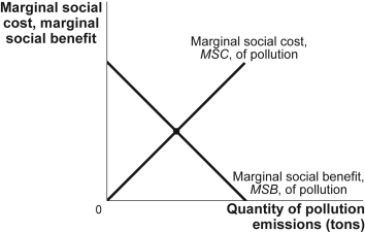
-(Figure: The Socially Optimal Quantity of Pollution) In the figure The Socially Optimal Quantity of Pollution, the optimal level of pollution is:
A) zero, since no pollution is best for society.
B) where the marginal social benefit curve intersects the quantity axis.
C) where the marginal social cost curve intersects the quantity axis.
D) where the marginal social benefit curve intersects the marginal social cost curve.
Correct Answer:

Verified
Correct Answer:
Verified
Q6: Which of the following is an environmental
Q8: Use the following to answer questions: <img
Q11: Use the following to answer question:<br>Figure: The
Q12: Use the following to answer questions:<br>Figure: Model
Q13: Use the following to answer questions:<br>Scenario: Private
Q14: Use the following to answer questions: <img
Q15: Use the following to answer questions: <img
Q53: An external benefit is a:<br>A)negative externality.<br>B)benefit that
Q83: The efficient level of pollution is the
Q115: The government has adopted an emissions tax