Multiple Choice
Use the following to answer questions:
Figure: Monopoly Profits in Duopoly 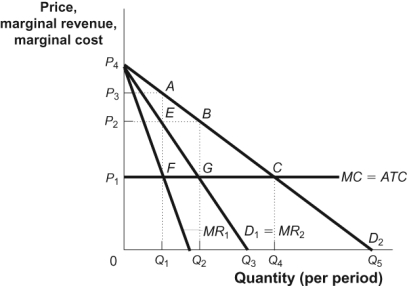
-(Figure: Monopoly Profits in Duopoly) The figure Monopoly Profits in Duopoly shows how an industry consisting of two firms that face identical demand curves (D1) can collude to increase profits. The market demand curve is D2. If the firms collude to share the market demand equally, then each firm will act as if its demand curve is given by:
A) D1.
B) D2.
C) MR1.
D) 2 × D1.
Correct Answer:

Verified
Correct Answer:
Verified
Q187: Cartels made up of a large number
Q196: Gary's Gas and Frank's Fuel are the
Q238: Use the following to answer questions: <img
Q239: Which of the following scenarios best describes
Q240: Maximization of joint profits is most likely
Q241: The most important source of oligopoly in
Q242: Use the following to answer questions:<br>Figure: Pricing
Q246: _ occurs when the only two firms
Q247: Which of the following is TRUE?<br>A) Once
Q248: A dominant strategy equilibrium occurs when:<br>A) a