Multiple Choice
Use the following to answer questions:
Figure: Collusion 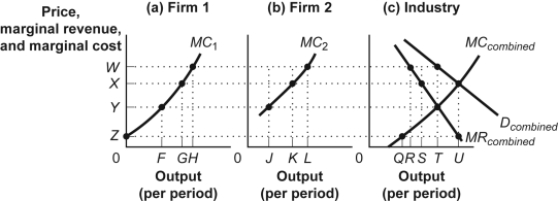
-(Figure: Collusion) Look at the figure Collusion. The quantity of output produced by firm 1 when there is collusion in the industry is shown by:
A) F.
B) G.
C) H.
D) K.
Correct Answer:

Verified
Correct Answer:
Verified
Related Questions
Q18: A strategy that is the same,regardless of
Q56: Gary's Gas and Frank's Fuel are the
Q150: If Delta offers free drinks and snacks
Q251: Use the following to answer questions: <img
Q252: Use the following to answer questions:<br>Scenario: Payoff
Q254: Use the following to answer questions:<br>Figure: Collusion
Q257: Use the following to answer questions: <img
Q259: Suppose that each of the two firms
Q261: Use the following to answer questions: <img
Q263: A firm that is in an oligopoly