Multiple Choice
Use the following to answer questions:
Figure: Consumer Equilibrium I
The figure shows three of Owen's indifference curves for pizza and soda per week. Owen has $180 per month to spend on the two goods. The price of a pizza is $20, and the price of a soda is $1.50. 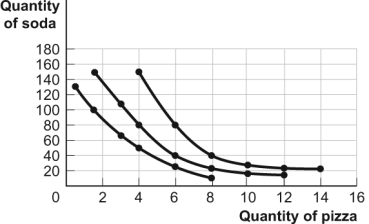
-(Figure: Consumer Equilibrium I) Look at the figure Consumer Equilibrium I. If Owen consumes 1.5 pizzas and 100 sodas, which of the following describes the relationship between his marginal rate of substitution of pizza for soda and the price of pizza in terms of soda?
A) The marginal rate of substitution equals the relative price.
B) The marginal rate of substitution is greater than the relative price.
C) The marginal rate of substitution is less than the relative price.
D) It is impossible to determine, given the information available.
Correct Answer:

Verified
Correct Answer:
Verified
Q1: The optimal consumption rule for all goods
Q2: Use the following to answer questions:<br>Figure: Indifference
Q3: Jennifer has $10 to spend on tomatoes
Q4: Use the following to answer questions: <img
Q8: Use the following to answer questions:<br>Figure: Consumer
Q9: After learning about indifference curves, Sandy realizes
Q16: Utility is the:<br>A)difference between a firm's total
Q38: The income effect will play a greater
Q63: If a consumer derives more utility by
Q86: Assume that Siri is consuming the utility-maximizing