Multiple Choice
Use the following to answer questions:
Figure: Harold's Indifference Curves
The figure shows three of Harold's indifference curves for bread and cheese. 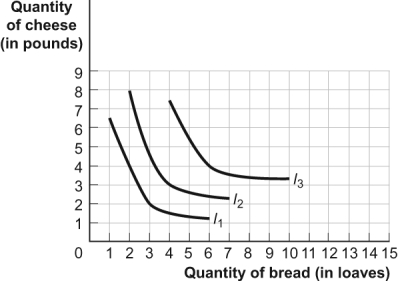
-(Figure: Harold's Indifference Curves) Look at the figure Harold's Indifference Curves. If the price of cheese is $2 per pound and Harold has $10 to spend on bread and cheese, Harold _____ his consumption of cheese as the price of bread rises from $1 per loaf to $2 per loaf, indicating that bread and cheese are _____.
A) increases; substitutes
B) increases; complements
C) decreases; substitutes
D) decreases; complements
Correct Answer:

Verified
Correct Answer:
Verified
Q29: For most goods,the income effect has no
Q73: A(n)_ is a curve that shows all
Q88: Since indifference curves depend on the _
Q113: A curve that represents combinations of two
Q127: Diminishing marginal utility is the reason most
Q151: According to the substitution effect,a decrease in
Q192: Use the following to answer questions:<br>Figure: Consumer
Q197: On a sparsely populated island, high-speed Internet
Q200: Use the following to answer questions:<br>Scenario: Music
Q201: Use the following to answer questions:<br>Figure: Consumer