Multiple Choice
The following question refers to the figure.
In this eight-year experiment, 12 populations of E. coli, each begun from a single cell, were grown in low-glucose conditions for 20,000 generations. Each culture was introduced to fresh growth medium every 24 hours. Occasionally, samples were removed from the populations, and their fitness in low-glucose conditions was tested against that of members sampled from the ancestral (common ancestor) E. coli population.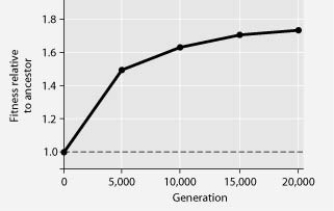
If the vertical axis of the figure above refers to relative fitness, then which of the following is the most valid and accurate measure of fitness?
A) number of daughter cells produced per mother cell per generation
B) average swimming speed of cells through the growth medium
C) amount of glucose synthesized per unit time
D) number of generations per unit time
Correct Answer:

Verified
Correct Answer:
Verified
Q9: The following question refers to the figure.<br>In
Q9: A hypothetical bacterium swims among human intestinal
Q10: Use the following information and graph to
Q11: The following question refers to the figure.<br>In
Q15: The following table depicts characteristics of
Q17: The following table depicts characteristics of
Q30: The thermoacidophile Sulfolobus acidocaldarius lacks peptidoglycan, but
Q36: Use the information in the following paragraph
Q41: Plantlike photosynthesis that releases O₂ occurs in<br>A)
Q62: Genetic variation in bacterial populations cannot result