Multiple Choice
The eight climographs show yearly temperature (line graph and left vertical axis) and precipitation (bar graph and right vertical axis) averages for each month for some locations on Earth.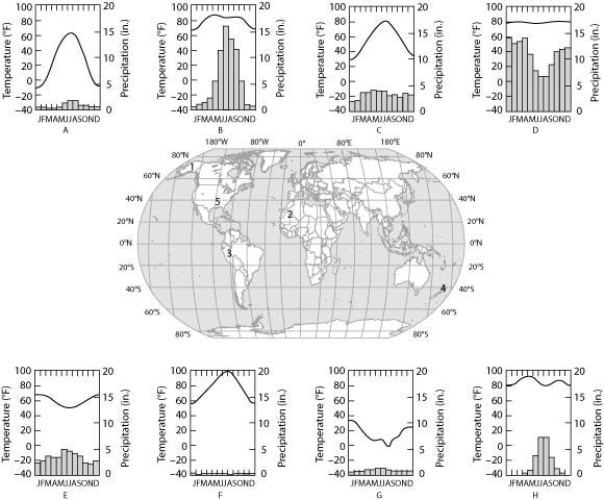
Which climograph shows the climate for location 1?
A) A
B) C
C) E
D) H
Correct Answer:

Verified
Correct Answer:
Verified
Related Questions
Q4: Which of these environmental factor(s) is/are the
Q9: If the direction of Earth's rotation reversed,
Q15: Two plant species live in the same
Q17: When climbing a mountain, we can observe
Q22: Imagine that a deep temperate zone lake
Q27: For mountain ranges that are subjected to
Q46: Which of the following causes seasons on
Q53: The main reason polar regions are cooler
Q56: Use the following figures to answer the
Q66: When climbing a mountain, we can observe