Multiple Choice
Use the graphs to answer the following question.
(a) 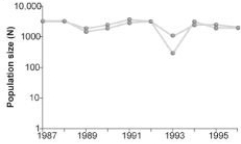
(b) 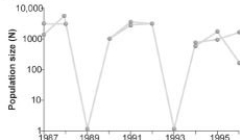
Graph (b) in the figure shows the normal fluctuations of a population of grouse, a ground-nesting bird. Assuming graph (a) in the figure is the result of some experimental treatment in the grouse population, what can be concluded?
A) The experimental treatment intensified the population cycling.
B) The experimental treatment did not affect population cycling in this species.
C) The experimental treatment has most likely identified the cause of population cycling.
D) The experimental treatment involved the introduction of a predator of the bird.
Correct Answer:

Verified
Correct Answer:
Verified
Q9: Which of the following graphs illustrates the
Q10: During exponential growth, a population always _.<br>A)
Q11: Use the graph to answer the following
Q13: Which of the following groups would be
Q14: A population of white-footed mice becomes severely
Q17: Use the survivorship curves in the figure
Q28: The observation that members of a population
Q44: Natural selection involves energetic trade-offs between _.<br>A)
Q44: Scientific study of the population cycles of
Q62: Which of the following causes populations to