Multiple Choice
Use the following graph and information to answer the question.
Flycatcher birds that migrate from Africa to Europe feed their chicks a diet that is almost exclusively moth caterpillars. The graph shows the peak dates of flycatcher arrival in Europe, bird hatching, and peak caterpillar season for the years 1980 and 2000. The y-axis is a measure of the abundance of birds, hatching chicks, and caterpillars.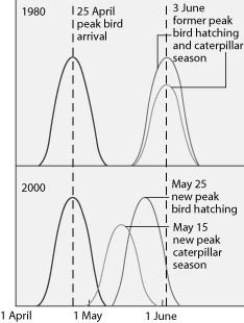
The shift in the peak of caterpillar season is most likely due to ________.
A) earlier migration returns of flycatchers
B) an innate change in the biological clock of the caterpillars
C) global warming
D) acid precipitation in Europe
Correct Answer:

Verified
Correct Answer:
Verified
Q7: Of the following ecosystem types, which have
Q8: Brown-headed cowbirds utilize fragmented forests effectively by
Q11: Your friend is wary of environmentalists' claims
Q22: If the sex ratio in a population
Q31: Introduced species can have deleterious effects on
Q54: Philippe Bouchet and colleagues conducted a massive
Q63: Use the following figure to answer the
Q64: To better comprehend the magnitude of current
Q64: Overharvesting encourages extinction and is most likely
Q68: Researchers have been studying a rare population