Multiple Choice
Use the following figure to answer the question.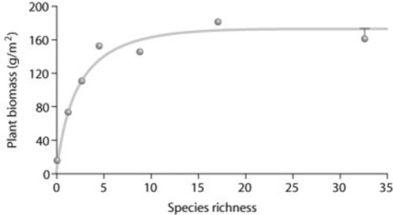
Looking at the figure, what can you conclude about the data?
A) As species richness changes, plant biomass remains consistent.
B) As species richness increases, plant biomass increases.
C) As species richness increases, plant biomass increases and then levels off.
D) As species richness decreases, plant biomass increases.
Correct Answer:

Verified
Correct Answer:
Verified
Q13: During the inventory of bacterial genes present
Q16: Burning fossil fuels releases oxides of sulfur
Q36: Which of the following nations has become
Q36: Which of the following statements is accurate
Q40: Which of the following is a consequence
Q48: The primary difference between the small-population approach
Q50: Which of the following is a generally
Q53: Establishing new nature reserves in biodiversity hot
Q63: Movement corridors can be harmful to certain
Q69: Tropical forests are being converted to farm