Essay
Use the data given below to answer the following question(s).
Following is the purchase order database of 'The Chef Says So', a restaurant in New York, over the last quarter (April-June).
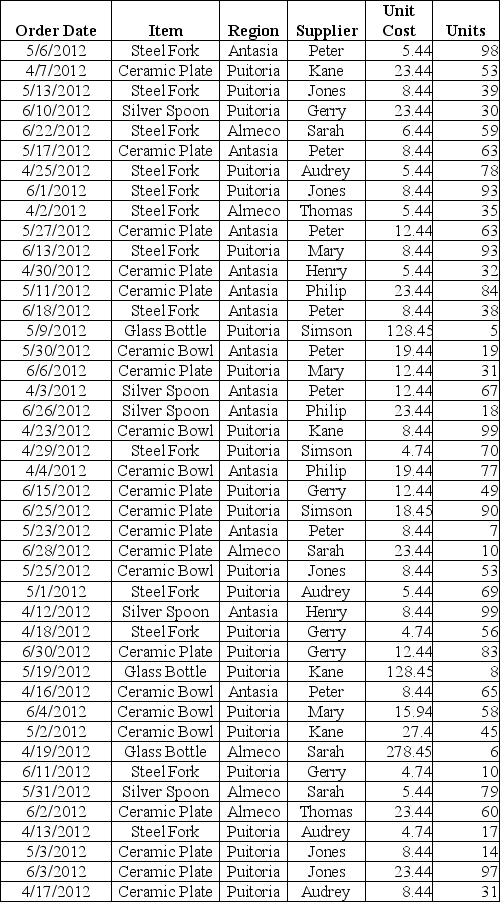
-Describe and construct a cross-tabulation showing the region-wise percentage breakdown of purchase of glass bottles and silver spoons and visually represent the data in a 3-D cylindrical chart.
Counts:
Percentages by Region:
Correct Answer:

Verified
Construct a pivot table with regions as ...View Answer
Unlock this answer now
Get Access to more Verified Answers free of charge
Correct Answer:
Verified
View Answer
Unlock this answer now
Get Access to more Verified Answers free of charge
Q3: Roger wants to compare values across categories
Q25: Use the data given below to
Q28: How does Excel distinguish between vertical and
Q29: Use the data given below to
Q33: Use the data given below to answer
Q37: After choosing the PivotTable, the PivotChart can
Q38: Which of the following charts shows three-dimensional
Q42: Use the data given below to answer
Q44: Which of the following charts allows plotting
Q45: Explain with an example the filtering tool