Essay
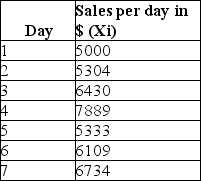
The table below shows the sales per day at a grocery store over a period of a week.Calculate the z-score for sales on Day 4.
Correct Answer:

Verified
Z-score is calculated using the formula,...View Answer
Unlock this answer now
Get Access to more Verified Answers free of charge
Correct Answer:
Verified
Z-score is calculated using the formula,...
View Answer
Unlock this answer now
Get Access to more Verified Answers free of charge
Related Questions
Q1: Which of the following is true for
Q5: is a measure of the linear relationship
Q30: The difference between the first and third
Q32: Give an account of Excel's Descriptive Statistics
Q35: Compare and contrast methods of summarizing
Q48: Which of the following formula is
Q48: The larger the variance, the more the
Q52: In statistical notation, the elements of a
Q54: According to the interquartile range, extreme outliers
Q73: How can outliers be identified in a