Multiple Choice
Use the graph as shown to determine the following limits, and discuss the continuity of the function at x= 4.
(i)  (ii)
(ii)  (iii)
(iii) 
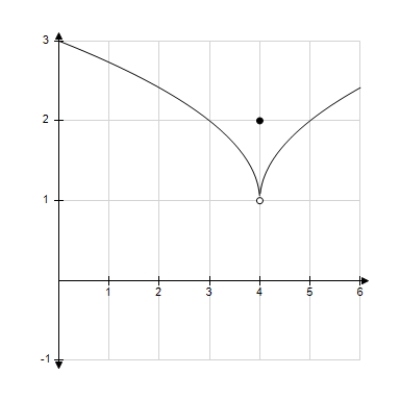
A) 1, 1, 1, not continuous
B) 2, 2, 2, continuous
C) 1, 1, 1, continuous
D) 2, 2, 2, not continuous
E) 0, 0, 0, not continuous
Correct Answer:

Verified
Correct Answer:
Verified
Q14: Find the limit. <img src="https://d2lvgg3v3hfg70.cloudfront.net/TB8527/.jpg" alt="Find
Q15: Complete the table and use the result
Q16: Find the x-values (if any) at which
Q17: Determine the limit (if it exists).
Q18: Find the limit. <img src="https://d2lvgg3v3hfg70.cloudfront.net/TB8527/.jpg" alt="Find
Q20: Find the limit (if it exists).
Q21: Use the graph to determine the following
Q22: Discuss the continuity of the function <img
Q23: Find the x-values (if any) at which
Q24: A long distance phone service charges $0.35