Essay
The diagram below shows how a rise in government expenditure (G) shifts the IS curve from IS1 to IS2. What are the levels of investments in Y1 and Y2 for a fixed r? 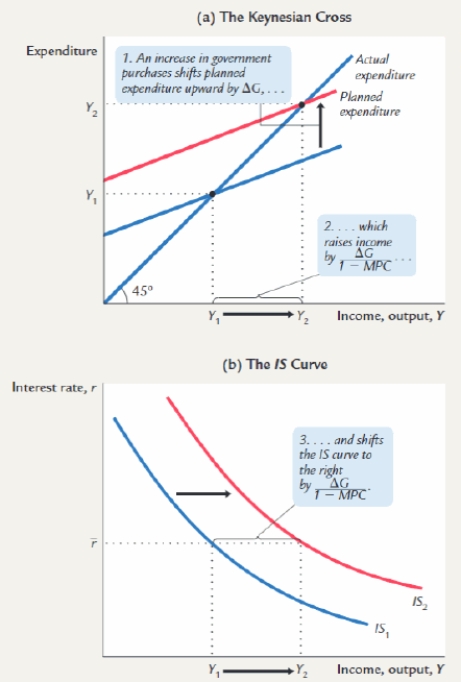
Correct Answer:

Verified
The investment level remains the same in...View Answer
Unlock this answer now
Get Access to more Verified Answers free of charge
Correct Answer:
Verified
View Answer
Unlock this answer now
Get Access to more Verified Answers free of charge
Q5: In the Keynesian-cross model, fiscal policy has
Q5: Both Keynesians and supply-siders believe a tax
Q6: In the Keynesian-cross model with a given
Q8: According to the Keynesian-cross analysis, if the
Q11: Using the Keynesian-cross analysis, assume that the
Q12: Assume an economy where the consumption function
Q18: The LM curve, in the usual case:<br>A)
Q23: The IS and LM curves together generally
Q65: An increase in the interest rate:<br>A) reduces
Q84: Assume that the money demand function is