Multiple Choice
A project is represented by the following graphs: 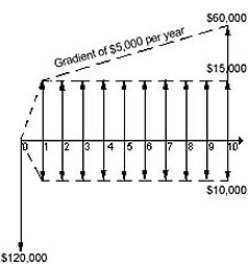
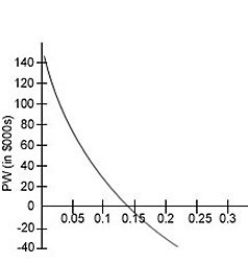 What is the internal rate of return for this project?
A) 0%
B) 4%
C) 10%
D) 14%
E) 15%
Correct Answer:

Verified
Correct Answer:
Verified
Related Questions
Q22: YVY Consulting group received a contract to
Q23: What is the IRR corresponding to this
Q24: Consider two mutually exclusive investments with a
Q25: What are the advantages and disadvantages of
Q26: The following table summarizes information for five
Q28: Unlike the internal rate of return method,
Q29: What is the major advantage of the
Q30: You have two ways to invest $1
Q31: A project is subject to the following
Q32: I sign a contract that guarantees me