Multiple Choice
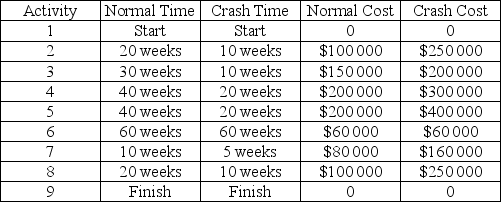
The AON diagram shown represents a project. Normal and crash times, and the associated costs, are shown for each activity in the accompanying table. The normal completion time for the project is 130 weeks. If it is worth $10 000 a week to reduce the project duration, what is the shortest economical crash time? 
A) There is no economical way to reduce completion time.
B) 10 weeks
C) 15 weeks
D) 20 weeks
E) 25 weeks
Correct Answer:

Verified
Correct Answer:
Verified
Q8: Describe three "best practices" to observe when
Q9: What are the advantages and disadvantages of
Q10: For an engineering project, the justification for
Q11: A fundamental advantage of the CPM networks
Q12: How do we find a project's critical
Q14: Project execution includes<br>A)economic evaluation of the project's
Q15: What is meant by "crashing a project"?
Q16: In a single sentence, what is project
Q17: In crashing a project, what should be
Q18: Suppose that the crash cost is $10