Short Answer
Use the graphical approach to CVP analysis to solve the following problem.
A small manufacturing operation can produce up to 250 units per week of a product that it sells for $20 per unit. The variable cost per unit is $12, and the fixed costs per week are $1200.
a) How many units must the firm sell per week to break even?
b) Determine the firm's weekly profit or loss if it sells:
(i) 120 units per week (ii) 250 units per week
c) At what level of sales will the net income be $400 per week?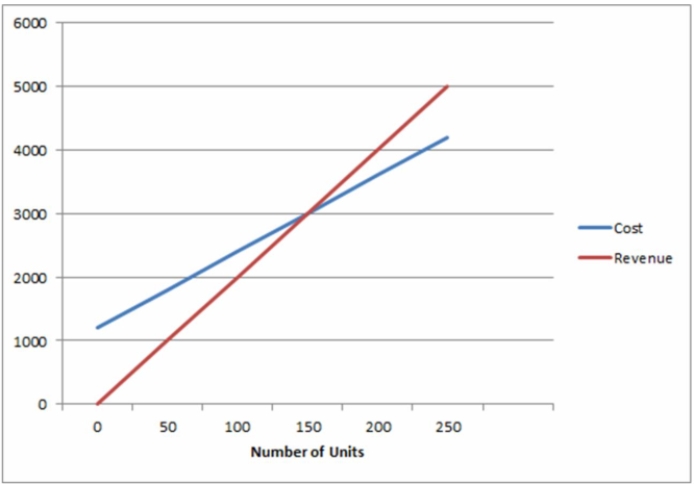
Correct Answer:

Verified
a) 150 units
b) i) ...View Answer
Unlock this answer now
Get Access to more Verified Answers free of charge
Correct Answer:
Verified
b) i) ...
View Answer
Unlock this answer now
Get Access to more Verified Answers free of charge
Q22: Dynacan Ltd. manufactured 10,000 units of product
Q23: A manufacturing company is studying the feasibility
Q24: Use the graphical approach to CVP analysis
Q25: A manufacturing company is studying the feasibility
Q26: Juniper Ltd. Manufactured 98,000 units of a
Q28: A small company can produce 500 dolls
Q29: Cliff runs a restaurant in a small
Q30: The Kelowna division of Windstream RVs builds
Q31: Mentis Ltd. Manufactured 350,000 units of a
Q32: Cliff runs a restaurant in a small