Short Answer
Use the graphical approach to CVP analysis to solve the following problem.
Valley Peat Ltd. sells peat moss for $10 per bag. Variable costs are $7.50 per bag and annual fixed costs are $100,000.
a) How many bags of peat must be sold to break even?
b) What will be the net income for a year in which 60,000 bags of peat are sold?
c) How many bags must be sold for a net income of $60,000 in a year?
d) What volume of sales would produce a loss of $10,000?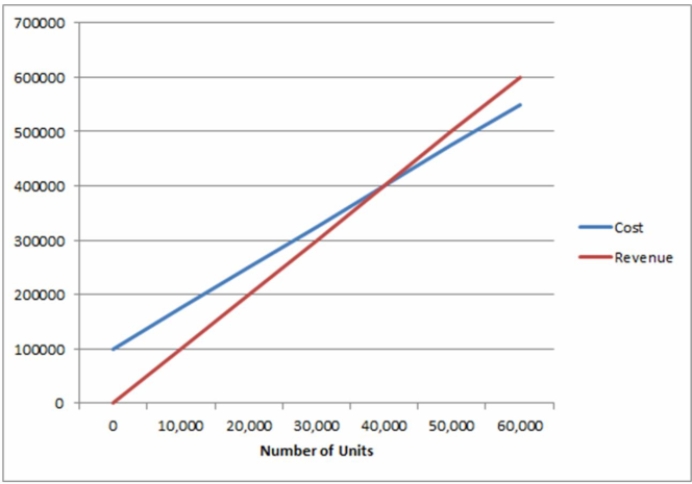
Correct Answer:

Verified
a) $40,000 bags/year...View Answer
Unlock this answer now
Get Access to more Verified Answers free of charge
Correct Answer:
Verified
View Answer
Unlock this answer now
Get Access to more Verified Answers free of charge
Q68: M Studios retails their own brand of
Q69: M Studios estimates that it can sell
Q70: Once a business is operating beyond the
Q71: Kuldip's factory manufactures toys that sell for
Q72: A company makes gadgets selling for $15
Q74: A manufacturing company is studying the feasibility
Q75: M Studios retails their own brand of
Q76: A manufacturing company is studying the feasibility
Q77: Kuldip's factory manufactures toys that sell for
Q78: The selling price of a widget is