Multiple Choice
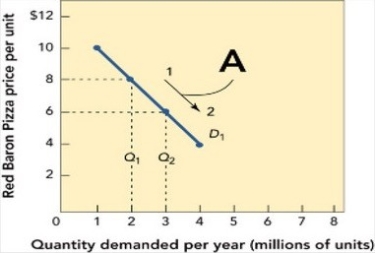 Figure 11-3a
-Figure 11-3a shows shows that when the quantity demanded for Red Baron frozen cheese pizzas moves from 2 to 3 million units along the demand curve D1, the profit
A) increases from $6 to $8 per unit.
B) decreases from $8 to $6 per unit.
C) stays the same per unit.
D) increases from $2 to $3 per unit.
E) impacts cannot be determined. Figure 11-3a does not indicate what happens to profit when the quantity demanded changes.
Correct Answer:

Verified
Correct Answer:
Verified
Q91: Which of the following is a cost-oriented
Q179: The practice of simultaneously increasing product and
Q185: Tara is enrolled for spring semester at
Q207: Barter is<br>A) a reciprocity agreement stipulating that
Q220: If a McDonald's menu board advertises Mini
Q254: The practice of charging different prices to
Q286: Penetration pricing is intended to appeal to
Q295: Several factors indicate that a penetration pricing
Q301: If you were to buy one peach
Q305: Marketing executives must translate estimates of customer