Multiple Choice
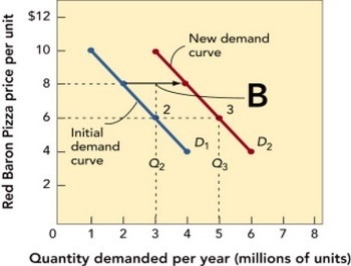 Figure 11-3b
-Figure 11-3b above shows that when the quantity demanded for Red Baron frozen cheese pizzas moves from 2 to 3 million units from the demand curve D1 to the demand curve D2, the profit
A) impacts cannot be determined. Figure 11-3b does not indicate what happens to profit when the quantity demanded changes.
B) increases from $2 to $3 per unit.
C) stays the same per unit.
D) increases from $6 to $8 per unit.
E) decreases from $8 to $6 per unit.
Correct Answer:

Verified
Correct Answer:
Verified
Q5: Which of the following statements regarding pricing
Q104: While consumer tastes and price and availability
Q115: <img src="https://d2lvgg3v3hfg70.cloudfront.net/TB8552/.jpg" alt=" Figure 11-6a -In
Q116: <img src="https://d2lvgg3v3hfg70.cloudfront.net/TB8552/.jpg" alt=" Figure 11-3 -The
Q123: Describe the pricing constraints a firm is
Q153: Reductions in unit costs for a larger
Q171: To increase value, marketers may _, decrease
Q173: Which of the following statements about consumer
Q231: When buying highly technical, few-of-a-kind products such
Q289: Manufacturers use seasonal discounts to<br>A) get rid