Multiple Choice
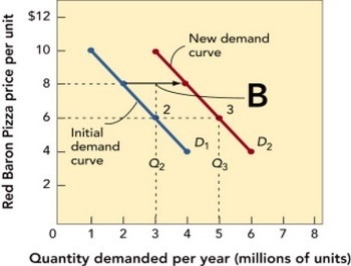 Figure 11-3b
-In Figure 11-3b above, the demand curve shifts from D1 to D2. This most likely represents
A) an increase in demand that did not require a change in price but was the result of a change in one or more demand factors.
B) an increase in demand that required a decrease in price.
C) no change in price and a decrease in demand that results from internal business practice changes.
D) no change in demand or price but a greater profit due to economies of scale.
E) a decrease in price from $8 to $6 per unit.
Correct Answer:

Verified
Correct Answer:
Verified
Q57: Which of the following is a competition-oriented
Q109: Several companies produce latex gloves that are
Q120: A reduction from the list price that
Q127: Price fixing is illegal under the<br>A) Sherman
Q235: A price reduction given when a used
Q318: Price deals that mislead consumers fall into
Q333: Setting different prices for products and services
Q336: A Price Premium Marketing Dashboard shows the
Q337: Recently, much of the western United States
Q352: The four types of discounts are<br>A)quantity, trade-in,