Multiple Choice
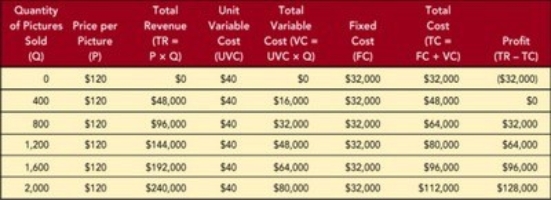 Figure 11-6
-A graphic presentation of the break-even analysis that shows the intersection of total revenue and total cost to identify profit or loss for a given quantity sold is referred to as a
A) Gantt chart.
B) demand curve.
C) ROI analysis.
D) cross-tabulation.
E) break-even chart.
Correct Answer:

Verified
Correct Answer:
Verified
Q11: Which of the following statements is most
Q22: The manufacturer of a new kind of
Q23: How do consumers use price in their
Q25: According to the price equation, a product's
Q26: A manufacturer of a portable digital HD
Q29: A hardware store advertises a 3/8" Black
Q50: Distinguish between elastic demand and inelastic demand.
Q225: The total expense incurred by a firm
Q287: The pricing strategy that is almost the
Q306: Quantity discounts are<br>A) price reductions in unit