Multiple Choice
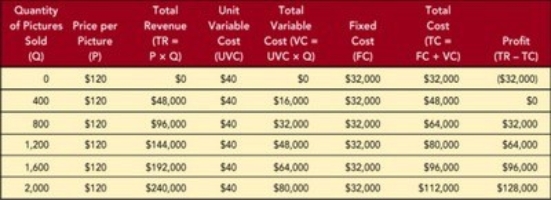 Figure 11-6
-A break-even chart is a graphic presentation
A) that shows the maximum number of units that will be sold at a certain price.
B) of a break-even analysis that shows where total revenue and total cost intersect to identify profit or loss for a given quantity sold.
C) that relates variable costs in terms of product or service substitutes in order to determine which items or services would least affect total revenues.
D) that relates profits and revenues versus total costs in order to determine the time frame in which a company could achieve profitability.
E) is a form of scatter graph used to identify specific activities or items that are creating the greatest return on investment.
Correct Answer:

Verified
Correct Answer:
Verified
Q9: You are president of an electric appliance
Q11: Which of the following statements is most
Q13: Which of the following statements regarding odd-even
Q15: Which of the following best illustrates a
Q16: A reference value is developed by the
Q55: If a firm finds the demand for
Q92: There are four common approaches to selecting
Q177: The owner of a small restaurant that
Q209: Rather than billing clients by the hour,
Q227: Which of the following statements about the